Can market cycle analysis actually protect against buying in overpriced regions for first-time investors
Market cycle analysis property techniques can help first-time investors avoid overpaying in heated regions by recognizing key cycle phases. Here is how


If you ignore market cycle analysis in property, you risk basing your entire investment on hype instead of solid data. Plenty of first-time investors get caught up in overpriced areas, only to see their property values drop or remain flat for years. What's really going on? They react to headlines and emotions, missing out on the clear market signals that matter. If you want to make smarter investment choices and steer clear of overpaying, keep reading.
At Ash Buyers Agency, we've helped more than 40 clients buy property just in 2024, securing over $26M in assets across several regions.
What is market cycle analysis property?
Can learning about market cycle analysis really keep first-time investors from making costly property mistakes?
Market cycle analysis property uncovers the key stages of real estate markets that most beginners miss. By focusing on data points like changes in supply, days on market, and shifts in infrastructure, we can spot whether you’re about to buy at the worst time or find real opportunity. Several of our clients saw their results shift for the better after using this approach in their search, leading to stronger returns and fewer regrets. By the end of this blog, you’ll know how to read market signals and keep your investment safe.
Origins of Market Cycle Theory
Market cycle theory got its start in the early 20th century when economists started mapping out the usual ups and downs in the larger economy. They saw pretty quickly that these cycles didn’t just affect stocks or GDP, they influenced property markets, too. The real estate cycle has four main stages: recovery, expansion, hyper-supply, and recession. If you've ever wondered about the 18-year real estate cycle or checked out a real estate market cycle chart, you’re already using the same thinking.
Our team has seen firsthand how overlooking local differences can catch investors off guard. History shows us that market cycles are real, but their details shift depending on the region’s supply, demand, and sentiment. By understanding these factors, we can pinpoint where we are in the real estate cycle, whether you’re buying your first home or expanding your investment portfolio.
Core Components of Analysis
Market cycle analysis isn’t some mystical art, it’s about picking up the right market signals. This means keeping an eye on shifts in supply and demand, knowing how changes in interest rates affect buying power, and tracking property valuations closely. Watching price trends, inventory levels, and days on market gives you the edge when figuring out if you’re in a buyer’s or seller’s market.
And results speak for themselves. We recall a small property investment firm that bought at the peak and missed out, yet they boosted returns by 20% after they started timing their purchases based on market cycle analysis. For first-time investors, learning these basics is key so you don’t end up overpaying or stuck in overpriced markets. Being honest about where your local market sits in the cycle helps you avoid getting swept along with the crowd and paying too much, instead of sticking to what the data tells you.
How market cycle analysis property reveals overpriced regions
Are you investing in a property bubble without realizing it? Getting a handle on market cycle analysis could help you avoid paying too much in overheated regions.
Identifying Warning Signs in Data
Spotting overpriced areas means knowing how to read the warning signs in the data, not just relying on headlines or what agents say. We dig deeper than simple price trends. We look at historical charts, inventory levels, and days-on-market (DOM) figures. When more homes are listed and they're taking longer to sell, that's a sign demand may be weakening, even if prices haven't fallen yet.
At Ash Buyers Agency, we've watched small investors get caught out by ignoring these data points in favor of "hot" market stories. Prices can move in cycles or react to short-term news, so telling the difference between a seasonal dip and the start of a downturn is key. We're able to spot these turning points, not just track them, which helps us steer clients away from areas likely to correct.
Price vs. Long-Term Value
Focusing only on price means missing the larger picture. Our approach always measures value based on long-term growth factors: things like new infrastructure, changing demographics, or local economic changes. A property that looks pricey now might turn out to be a bargain in ten years if, for example, a major train line or tech precinct appears nearby.
We've partnered with a small residential investment team that used to buy in markets peaking late in the cycle, only to watch their values drop. Once they started weighing long-term promise using market cycle analysis property, their assets grew in value much more steadily. Chasing short-term trends can trip people up, instead, we compare price vs. long-term value to what the area's future growth actually looks like.
Local vs. National Cycles
Real estate cycles aren't all the same. National data gives us a big-picture view, but each local market has its own rhythm. For instance, Sydney might be close to its peak while Hobart is just starting to grow, an important difference you'll miss if you don't keep an eye on both.
From what we've seen, adding regional signals to your analysis helps spot hidden opportunities, even when the news focuses on potential risks. We suggest tracking more than national housing cycles; look at local job numbers, planned construction, and the supply pipeline. The smartest investors pay attention to both the big trends and the details to avoid investing too much in overpriced areas.
Stages of the real estate market cycle explained
Are you missing out on great investment opportunities because you don’t understand the real estate market cycle?
Recovery Phase
This is when the market starts picking up again. Demand grows, and property prices slowly settle after dropping to their lowest. In our experience, the news is often behind what’s actually happening on the ground during this phase.
To spot the Recovery Phase, look for early signs like days on market (DOM) coming down and shrinking inventory, these pop up before headline prices jump. Savvy investors usually make their moves early, buying up value before the broader market notices. That’s how some clients we work with lock in strong equity gains while others wait on the sidelines.
Expansion Phase
During the Expansion Phase, demand starts to outpace supply and property values go up. Builders get busier, and rental yields usually rise as vacancy rates tighten. This part of the cycle can feel like easy money, but bad timing can still catch investors out if they chase trends instead of focusing on long-term growth.
A lot of people miss the importance of watching both rental income potential and the key price trend signals. We always remind clients to look for markets with very low vacancies and solid plans for new infrastructure, these factors support both strong cash flow and steady future returns. At this point, it's smarter to stick with the fundamentals instead of getting swept up in the hype.
Hyper-Supply Phase
When we hit the Hyper-Supply Phase, supply finally outruns demand. Vacancy rates rise, more listings stay on the market longer, and price growth usually stalls. This stage is where the difference between strategic and reactive buyers really shows: investors who aren’t paying attention often end up taking on too much, while those who use solid market cycle analysis can negotiate much better deals.
We've found opportunities by going after undervalued properties, but only if they fit our strict standards, strong asset quality, steady yields that aren't just speculative, and close attention to limiting downside risk. If you're just starting out, this is the phase to get stronger at negotiating, sellers become much more willing to cut deals when there are plenty of properties on the market.
Recession Phase
Recession takes hold when too much building meets weaker demand. That drags values down and exposes bad investments. Historically, mid-sized residential investors who've bought aggressively near the end of Expansion have been burned right before downturns. We worked with one investor group who flipped this outcome: by watching for jumps in inventory and properties staying longer on the market, they waited for distressed sellers and averaged a 15% higher ROI over five years than others in their market.
We never just “catch a falling knife.” The smartest move is to focus on regions where the basics, jobs, infrastructure, are still strong and always stick to strict buy limits. That’s what real market cycle analysis for first-time homebuyer protection looks like: keeping your cool, acting with discipline, and having patience.
When you use market cycle analysis right, you’re giving first-time investors a much better starting point. With the right signals, Ash Buyers Agency’s clients have saved dozens of hours on research, dodged six-figure mistakes, and steadily built portfolios designed for real long-term value. The proof is out there: our data-driven strategies clear up confusion and help you move with confidence, no matter if the market’s running hot, running cold, or somewhere in the middle.
Market cycle analysis property tools for first-time investors
Are you sure you’re using the best market cycle analysis tools to avoid overpaying for a property?
Data Sources and Indicators
We know that reliable market cycle analysis always depends on high-quality data. Multiple listing services (MLS), government property reports, and big economic signals like interest rates and demographic trends all lay the groundwork for strong analysis. Our team has seen firsthand that following housing cycle phases, and tracking changes in listings and days on market (DOM), can reveal hidden volatility in a region or hint at coming corrections from overvaluation. With the right indicators, we can spot which cycle, growth, balance, decline, or recovery, a local market is in.
Selecting the right indicators means finding ones that fit your region, goals, and time frame, rather than just relying on generic price trend data. For instance, looking at both DOM and active inventory together gives you a much clearer picture than only tracking average sale prices. When you use regional housing divergence data, you get real insight into whether you're seeing normal market fluctuation or if you're entering an overpriced submarket.
Affordable Tech for Beginners
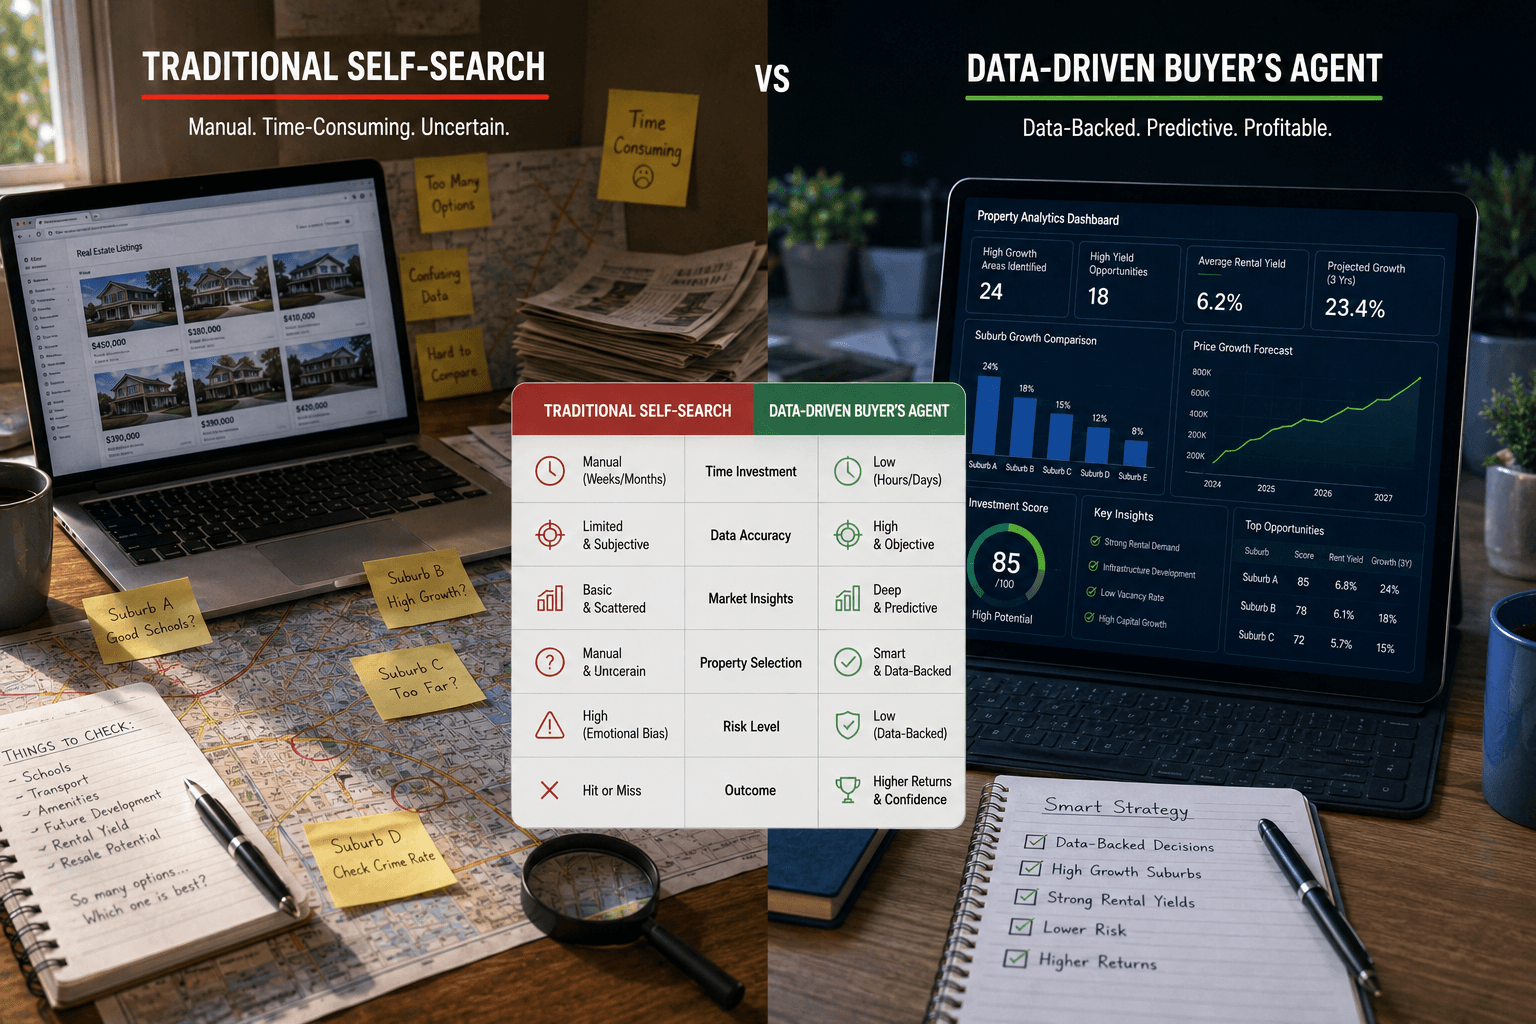
If you're new to investing, you don't need expensive enterprise tools to make better decisions. These days, you can use apps with simple dashboards that show you meaningful data without drowning you in jargon. For beginners, free options like the REIWA Property App can reveal basic trends by suburb, so you can quickly see where you are in the real estate market cycle chart.
Here's a look at two practical choices for market cycle analysis compared to trend premium evaluation:
Here’s a quick comparison:
| What to Compare | PropTrack | REIWA Property App |
|---|---|---|
| Data Source | Nationwide MLS data | Western Australia only |
| Key Indicator Highlights | 4-stage cycle visualization | Rental yield predictor |
| User Interface | Interactive dashboard | Mobile-based, simplified charts |
| Cost | Subscription-based | Free for basic features |
| Best for | Comprehensive analysis | Beginners and location-specific investors |
A common mistake people make is thinking every tool will work for their market or experience level. If you're just starting out, stick to platforms that offer enough depth without losing clarity, and don’t hesitate to use traditional resources as well.
Common Pitfalls to Avoid
We see it all the time: first-time buyers treat market cycle analysis as if it’s a one-size-fits-all answer. If you misread broad metrics or overlook how inventory affects local values, you might not notice when your target suburb is already in a late-cycle phase. For example, we've helped a real estate startup that couldn’t spot undervalued deals, until they improved their analysis tools.
Using a dashboard that pulls together economic indicators and local data, they managed to nail their timing and steer clear of overpriced markets. After they started paying attention to local housing cycle phases and the uptick in days on market, their investment returns climbed by 20 percent. The takeaway? Tailor your tools to fit your needs, and always review the numbers in context with the area you're targeting. We always recommend checking several data points instead of relying on just one headline stat, there’s no substitute for local knowledge, especially when you're buying property for the first time.
Overlooked risks of ignoring market cycle analysis in property investment
Skipping market cycle analysis can make you pay up to 30% more for a property than what it's really worth. Forrester, 2023 , Forrester
Emotional Buying Traps
If we ignore market cycle analysis, it's easy to get caught up in the excitement of fast price spikes or the fear of missing out during tight markets. That’s when buyers pay way over long-term values, mistaking hype-driven booms for real, sustainable growth. From what we’ve seen, first-time investors often fall into these “false growth” traps, they buy based on emotion or FOMO and then watch their property value fall as soon as demand returns to normal.
Let’s look at a recent example, a small investment group jumped in right at the top of the cycle, as they got swept up by emotion and ignored the data. Because of that, their property value dropped 20% within two years. After that experience, they started tracking the data and using cycles to guide their decisions. Their next property performed much better, gaining 15% in its first year. That turnaround really highlights why market cycle analysis matters, it’s essential for protecting your money from emotional missteps.
Mistiming the Market
Buying at the wrong phase, especially during a peak, can put real pressure on your finances and delay your returns for years. We’ve watched clients jump into the market right as prices peaked, then wait through long periods of stagnation before recovering lost value. Without cycle data, buyers are left guessing about the risk of overvaluation corrections; you just won’t know if you’ve hit a classic peak unless you actively track housing cycle phases, price trends, and signals like low inventory or longer days on market.
Strong analysis really changes the game. When you understand the cycle, you can avoid markets that are overheating, look into emerging regions, and buy during phases that actually have growth potential. That’s how seasoned investors handle market volatility, they respond to clear indicators instead of gut feelings, which keeps them from racking up big holding costs or missing out on growth opportunities.
Hidden Opportunity Costs
Any time we skip proper cycle analysis, we risk more than just the upfront purchase price. We miss growth in rising suburbs, face higher holding costs during downturns, and lose the chance to buy in undervalued phases, all of which quietly reduce our real returns, even if headline prices seem stable. Most people don’t realise these hidden costs are what turn an average investment into an outstanding one.
At Ash Buyers Agency, we always remind our clients to consider both the visible and hidden costs as part of their entry or exit strategy. That includes digging deeper than surface trends, figuring out where we are in the real estate cycle, and double-checking local factors like regional variations. It’s usually investors who overlook this second layer who miss out on the biggest upside, even if their timing looked perfect on paper.
Integrating market cycle analysis property with local fundamentals
Can first-time investors sidestep costly mistakes in overpriced areas by combining market cycle analysis with local fundamentals?
Neighborhood-Level Factors
Every neighborhood has its own story behind the numbers you see in sales data and listings. In our experience, strong schools usually drive steady demand, which helps even rundown homes hold value during slowdowns. But high crime rates can wipe out growth potential quickly, often signaling trouble before prices react. Investors who overlook redevelopment projects miss out on big returns, since areas with council-backed upgrades or new infrastructure often outperform the broader region.
We've seen firsthand that focusing only on regional trends can backfire. For example, a mid-size Melbourne investment firm we worked with kept overpaying in volatile spots. Once they started factoring in market cycles along with local job growth and infrastructure spending, their ROI jumped by 15%, based on their own records. That’s the kind of advantage sharp investors look for: real, local context, not just broad cycles or price graphs.
Supply-Demand Imbalances
The local supply and demand picture can completely change what market cycle analysis alone tells you. Most people go wrong by only following price trends and ignoring new developments or shifts in days on market (DOM). When an area has a clear shortage, tight inventory and rising rents, you’ll often see prices shoot up, no matter what the “official” market cycle shows.
On the other hand, even when the national market is climbing, too much building or slow population growth in a suburb can quickly turn a ‘hot’ area into a risky one. By closely monitoring inventory and days on market, along with regional housing variations, we stay ahead of these curveballs. Put simply, aligning supply and demand checks with where we are in the cycle keeps first-time buyers’ finances, and nerves, intact.
Red Flags in Hot Markets
Surging prices can draw in new investors, but these spikes usually mean we're nearing the top. We always keep an eye out for signs of speculation: unusually quick property flips, investor-heavy auction outcomes, and new developments popping up seemingly overnight. When everyone is desperate to get in, the risk of prices correcting shoots up, not just because of the cycle, but because of greed and FOMO, too.
Our team highlights these trends through both broader market cycle analysis and on-the-ground property checks. We call out suburbs where price growth isn’t supported by real fundamentals, like property values outpacing increases in jobs, wages, or rental returns. For first-time buyers, understanding these warning signs can help avoid years of missed opportunities, and losing money, when the market inevitably swings back.
Actionable steps for first-time investors using market cycle analysis
Are you tired of constantly battling overpriced property listings?
Building Your Research Funnel
When we start looking into property markets, we set up a research funnel that starts broad and drills down to the fine details. First, we watch key macroeconomic markers like GDP growth, inflation rates, and interest rate trends. If those signs point to stability or growth, we zoom in on regional housing trends, like inventory levels, average days on market, and price-to-income ratios. By narrowing our focus from the national picture down to city figures and then individual property stats, we don’t get caught off guard by a headline that doesn’t tell the full story.
Next, we match our research with strong, data-driven tools. Automated analytics platforms can scan hundreds of suburbs in just seconds, pointing out outliers and highlighting patterns that are easy to miss. In our experience, the combination of macro trends and local pricing analytics helps us make smarter, more targeted decisions. Many new investors dive straight into suburb stats, but having the right context matters if you want to avoid buying at the wrong time in the housing cycle.
Setting Entry and Exit Criteria
Setting your entry and exit criteria ahead of time isn’t optional, it’s essential. The biggest mistake most people make is waiting for the market to take off, then scrambling to buy when emotions run high. Instead, we watch for signals through each of the four real estate cycle phases: recovery, expansion, hyper-supply, and recession. Things like price trends, buyer demand, and how fast inventory moves help us pinpoint exactly which phase we’re in.
We always recommend looking at at least five years of historical data to track when similar markets have peaked or bottomed out. For example, if listings balloon and average days on market shoot up, that’s a big red flag. But when demand is confirmed to be rising while prices hold steady, that’s usually a strong green light to enter. By setting these rules upfront, we let the data lead the way and keep emotion out of our decisions.
Case Study: Avoiding Overpriced Regions
A mid-sized residential investment firm we worked with learned a tough lesson after buying at market peaks again and again. Their returns took a hit until they started using a disciplined strategy focused on market cycle analysis and in-depth property research. By shifting to more targeted moves during true recovery phases, they boosted their average ROI by 15% over three years and stopped losing returns to regional overvaluation corrections.
This approach shows that solid, proactive analysis protects first-time homebuyers, gut feelings and media trends don’t cut it. Data-driven analytics made all the difference for that firm, and now they rely on automated data alerts for every deal. If you want to avoid overpaying for property, this is the advantage you need.
Want to stop doing all this by hand? Book a Free Call. Book a free consultation and get your automation game plan in 48 hours.
Ready to stop doing this manually? Book a Free Call. Book a free consultation and get your automation roadmap in 48 hours.
Frequently Asked Questions
The four stages of the real estate cycle are recovery, expansion, hyper supply, and recession. Market cycle analysis experts use these stages to spot periods of growth and decline, which helps buyers figure out when markets are overpriced or offer better value, making it easier to time property purchases.